Introduction: Why Heart Metrics Matter for More Than Just Medical Checkups
In today’s data-driven world, we are increasingly equipped with tools to monitor our bodies, from wearable fitness trackers to digital health dashboards. Yet, many individuals still overlook one of the most fundamental indicators of their health: their blood pressure and pulse rate. These two numbers are more than just figures on a chart; they provide a snapshot of cardiovascular health, resilience under stress, and long-term performance potential. For those engaged in endurance training or seeking enhanced physical performance, understanding the significance of a healthy blood pressure and pulse rate chart can be transformative. When correctly interpreted, these metrics serve as early warning signs, progress markers, and decision-making guides for both lifestyle changes and training routines. Importantly, they offer insight into one essential question: does good blood pressure mean a healthy heart?
You may also like: Smart Nutrition Choices for a Healthier Lifestyle: What to Know About Whole Grain Rice and Whole Wheat Rice

What Is a Healthy Blood Pressure and Pulse Rate Chart?
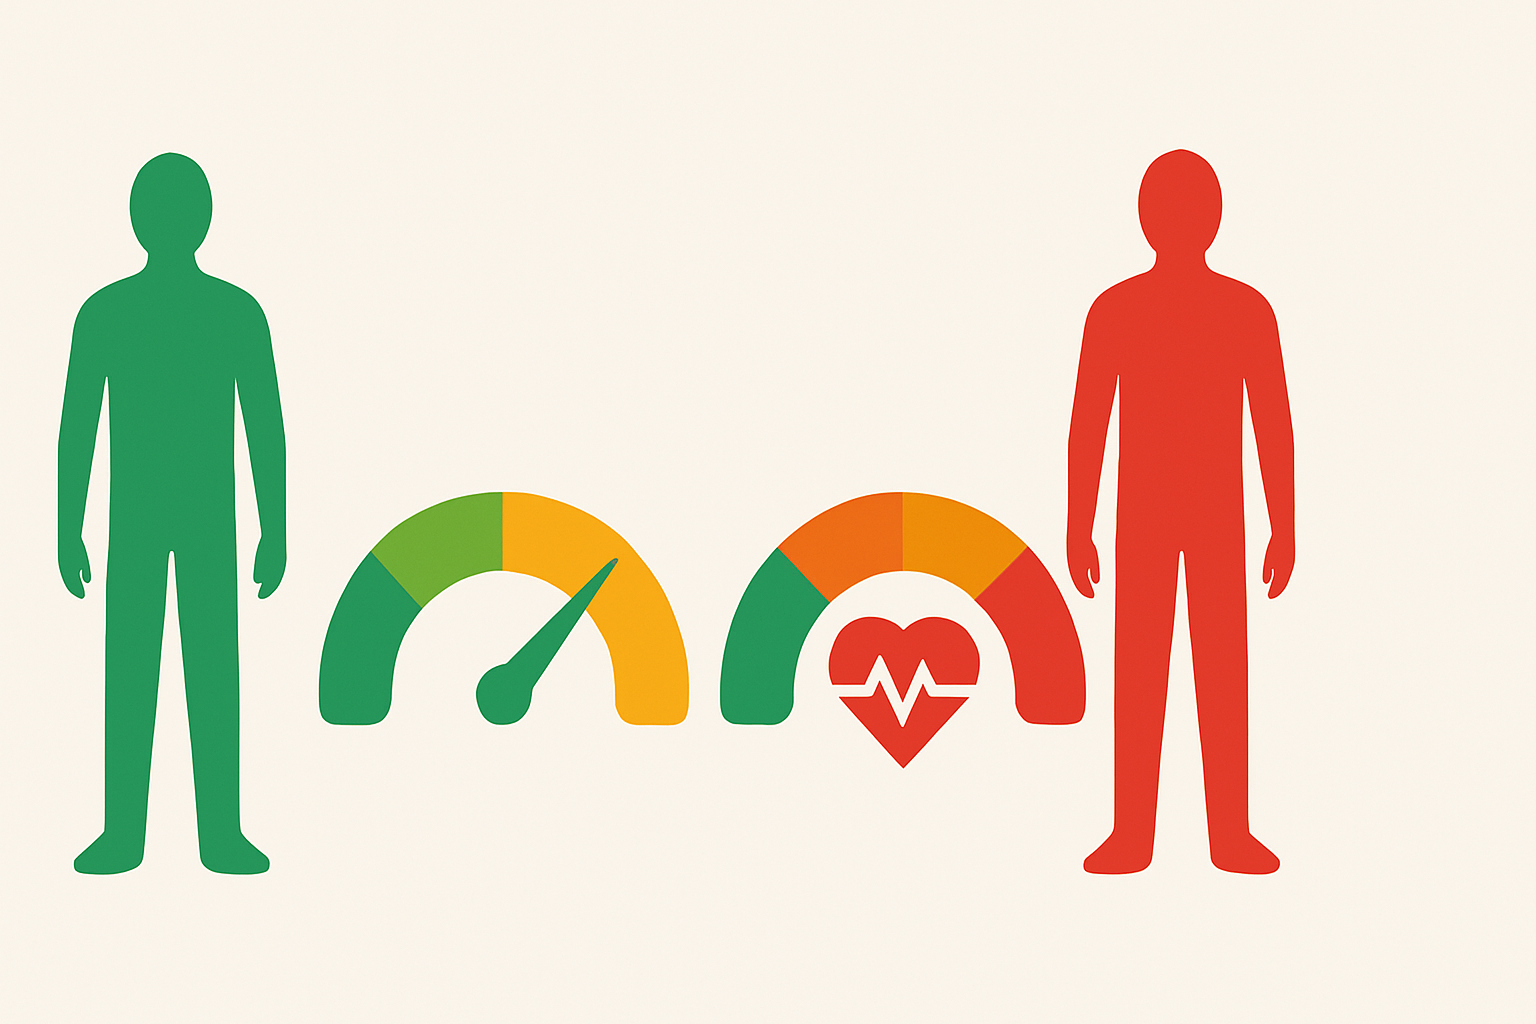
A healthy blood pressure and pulse rate chart represents the range of normal values considered safe and optimal for most individuals. Blood pressure is typically expressed in two numbers: systolic over diastolic. The systolic number measures the pressure in your arteries when your heart beats, while the diastolic measures it when the heart rests between beats. According to the American Heart Association, a normal reading is usually around 120/80 mm Hg. Anything consistently above this could signal hypertension, while anything too low may suggest hypotension.
Pulse rate, also known as resting heart rate, measures how many times your heart beats per minute when you’re at rest. A healthy range for most adults is between 60 to 100 beats per minute, although athletes often have resting rates significantly lower, sometimes around 40 to 60 bpm, due to greater cardiovascular efficiency. A healthy blood pressure and pulse rate chart integrates both these values to help individuals assess their cardiovascular fitness and risk levels. Understanding where you fall on this chart allows for better self-monitoring and provides essential data points for discussions with healthcare providers.

Interpreting Your Numbers: What They Really Mean for Your Health
Reading a blood pressure and heart rate chart goes beyond knowing what is normal or abnormal. For example, elevated systolic pressure with a normal diastolic reading may indicate isolated systolic hypertension, which is particularly common among older adults. On the other hand, a high pulse rate combined with normal blood pressure could signal overtraining, dehydration, or even an underlying arrhythmia. By cross-referencing your numbers with a trusted chart, you gain a more nuanced understanding of your body’s current state.
For athletes and those in performance training, a consistently low resting pulse rate can be a sign of excellent cardiovascular conditioning. However, it should not exist in a vacuum. A healthy reading should align with other indicators such as energy levels, breathing patterns, and recovery time after workouts. Similarly, having a blood pressure reading within the normal range doesn’t automatically confirm that your heart is in perfect health. That’s why asking “does good blood pressure mean healthy heart?” is important—and the answer depends on a variety of interrelated factors that require deeper exploration.

The Relationship Between Blood Pressure, Heart Rate, and Cardiovascular Performance
From a performance standpoint, the interrelationship between blood pressure and pulse rate is crucial. When exercising, both values naturally increase to accommodate greater oxygen and nutrient delivery to working muscles. However, how quickly these metrics return to baseline afterward is an equally telling sign. A slower recovery could indicate poor cardiovascular conditioning or possible arterial stiffness, whereas rapid normalization often reflects a highly adaptable, healthy heart.
The healthy blood pressure and pulse rate chart isn’t just a reference for disease prevention—it’s a diagnostic tool for optimizing endurance and stamina training. Athletes often track heart rate variability (HRV), resting heart rate trends, and post-exercise blood pressure to fine-tune their training regimens. For them, numbers on a chart can directly correlate with VO2 max, lactic threshold, and other performance outcomes. Even for non-athletes, learning to read and respond to these metrics can lead to better decisions around sleep, hydration, diet, and physical activity.
Does Good Blood Pressure Mean a Healthy Heart? A Closer Look
It’s a common misconception that a normal blood pressure reading guarantees a healthy heart. While blood pressure is a valuable cardiovascular metric, it is only one piece of a much larger puzzle. A person could have ideal blood pressure but still suffer from conditions such as coronary artery disease, arrhythmias, or heart valve dysfunction. These issues may not present abnormal blood pressure readings until they are significantly advanced.
To truly assess heart health, one must consider additional diagnostic tools such as electrocardiograms, stress tests, echocardiograms, and blood lipid panels. The healthy blood pressure and pulse rate chart is an important starting point, but it must be interpreted alongside other markers. Moreover, lifestyle factors like smoking, chronic stress, poor diet, and lack of physical activity can quietly deteriorate heart health even when blood pressure remains within a normal range. Therefore, while good blood pressure is certainly a positive sign, it should never be taken as definitive proof of cardiovascular wellness.

Training Smarter with Blood Pressure and Heart Rate Data
One of the most empowering ways to use a blood pressure and heart rate chart is in tailoring your exercise and recovery protocols. Endurance athletes, for example, might use morning pulse readings to determine if they are fully recovered or still under strain from previous workouts. An unusually high morning pulse, even in the absence of symptoms, can suggest overtraining or insufficient recovery, prompting a rest day rather than a workout.
Likewise, blood pressure responses to exercise can guide training intensity. If blood pressure spikes excessively during moderate exercise, it could indicate a need to scale back or consult a healthcare professional. Conversely, a stable increase within expected ranges suggests that the cardiovascular system is adapting efficiently. Over time, consistent monitoring helps build a personalized performance profile, highlighting how your heart and vessels respond to different forms of stress. This adaptive strategy not only improves endurance but also helps prevent injuries, fatigue, and long-term complications.

Understanding Deviations: What Outliers Can Reveal About Your Health
When your readings fall outside the healthy blood pressure and pulse rate chart ranges, it’s important to determine whether these are momentary fluctuations or persistent patterns. Temporary spikes in blood pressure or heart rate can result from caffeine, stress, lack of sleep, or even medications. However, consistent abnormalities warrant deeper investigation.
For instance, chronically low blood pressure (hypotension) accompanied by dizziness or fatigue could indicate adrenal insufficiency or heart valve problems. On the other end, persistently high pulse rates may reflect anemia, thyroid imbalances, or hidden infections. Especially for individuals engaged in regular endurance training, the body’s demands may unmask underlying conditions that would otherwise go unnoticed. Keeping a journal or using wearable devices to track these deviations over time can help spot trends and facilitate timely interventions.
The Psychological Implications of Cardiovascular Awareness
Monitoring blood pressure and heart rate not only supports physical health but also enhances psychological well-being. There’s a growing body of evidence linking heart rate variability with stress resilience and emotional regulation. Athletes and high performers often use biofeedback to consciously lower their heart rate or improve HRV, cultivating greater focus and calm under pressure.
Moreover, understanding one’s numbers fosters a sense of agency. Rather than reacting to symptoms after they arise, individuals become proactive in maintaining cardiovascular health. This shift from reactive to preventative care has profound implications. For example, individuals who regularly track and interpret their heart data are more likely to adhere to exercise routines, maintain balanced diets, and avoid harmful behaviors. The healthy blood pressure and pulse rate chart thus serves not only as a clinical tool but also as a psychological motivator.

Technology, Wearables, and the Future of Personalized Cardiovascular Insights
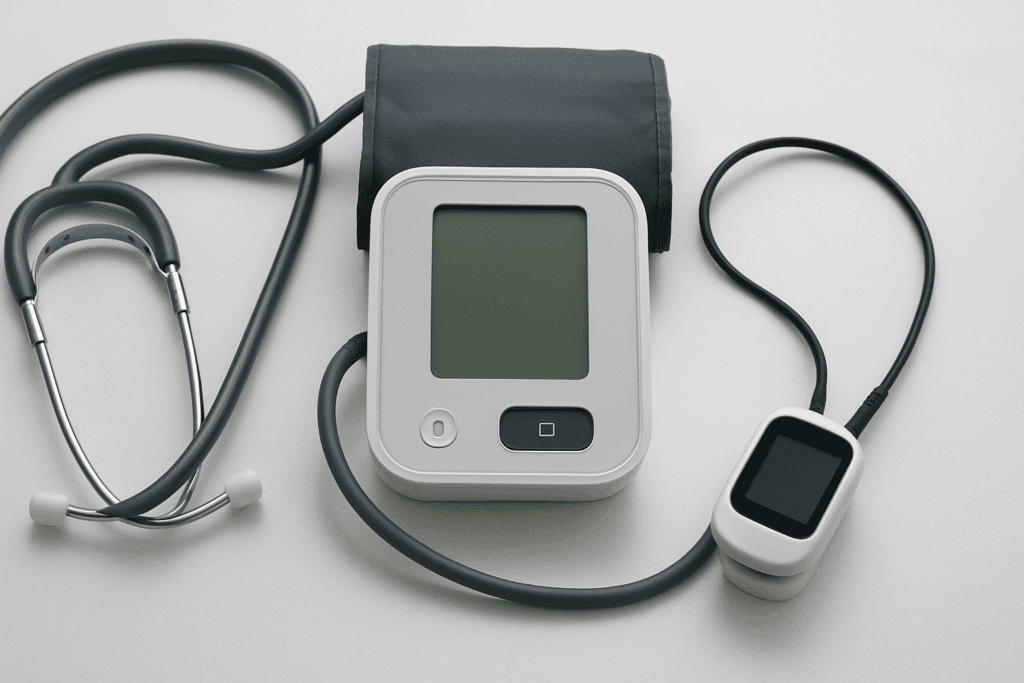
With the rise of wearable fitness trackers and smartwatches, real-time access to blood pressure and heart rate data has become more widespread than ever. Devices now offer continuous monitoring, trend analysis, and personalized alerts when values fall outside healthy ranges. These technologies are revolutionizing how we engage with the healthy blood pressure and pulse rate chart, turning it from a once-a-year doctor’s visit staple into a daily reference point.
Importantly, this democratization of health data empowers individuals to take charge of their own well-being. For example, users can identify patterns between poor sleep and elevated morning pulse rates, or recognize how different types of workouts affect their blood pressure over time. While these devices do not replace medical diagnostics, they offer a valuable early warning system and enable data-informed conversations with healthcare professionals. As algorithms become more advanced and AI integration deepens, we can expect even more nuanced insights, enhancing both health outcomes and athletic performance.
Frequently Asked Questions (FAQ): Understanding the Healthy Blood Pressure and Pulse Rate Chart
1. Can stress impact my position on the blood pressure and heart rate chart, even if I feel fine physically? Absolutely. Stress plays a surprisingly powerful role in shifting your values on the blood pressure and heart rate chart, even when you don’t feel overtly anxious. Chronic psychological stress activates the sympathetic nervous system, raising both blood pressure and resting heart rate over time. Even subtle, ongoing tension—such as work pressure or sleep disruption—can create a cardiovascular strain that doesn’t necessarily manifest as noticeable symptoms. Long-term stress can also lead to arterial stiffness, reducing the heart’s efficiency despite otherwise healthy numbers on the chart. Therefore, incorporating stress reduction practices like deep breathing, mindfulness, or nature walks can be just as vital as exercise or diet in maintaining your place within a healthy blood pressure and pulse rate chart.
2. How does altitude affect readings on a healthy blood pressure and pulse rate chart? Living or training at higher altitudes can significantly influence your readings on a blood pressure and heart rate chart. Due to reduced oxygen availability at higher elevations, your body compensates by increasing heart rate to maintain adequate oxygen delivery to tissues. Blood pressure may also rise temporarily during acclimatization, especially in individuals unaccustomed to elevation changes. For athletes training at altitude, these variations can be part of a strategic plan to enhance endurance and performance. It’s important to interpret the healthy blood pressure and pulse rate chart with these environmental factors in mind, recognizing that temporary deviations in a high-altitude setting may be entirely normal and even beneficial when part of a structured adaptation process.
3. Are fluctuations throughout the day on the blood pressure and heart rate chart a cause for concern? Fluctuations in blood pressure and pulse are not only normal but expected, and the healthy blood pressure and pulse rate chart should be viewed within this context. Both values naturally rise upon waking, stabilize throughout the day, and drop again during sleep. However, repeated spikes or drops outside the typical daily rhythm—especially without clear cause—can signal cardiovascular stress, hormonal imbalances, or issues with hydration and electrolyte levels. Rather than relying on a single snapshot, it’s more helpful to monitor trends across different times and days. This approach allows you to determine if changes are due to lifestyle shifts or if further investigation is warranted.
4. Does good blood pressure mean healthy heart function even in the absence of regular exercise? Not necessarily. While a good blood pressure reading is reassuring, it doesn’t guarantee comprehensive heart health, especially for sedentary individuals. One of the common misconceptions embedded in the question “does good blood pressure mean a healthy heart?” is the assumption that numbers alone tell the whole story. Regular cardiovascular exercise supports myocardial strength, flexibility of blood vessels, and enhanced oxygen delivery—benefits that may not reflect in a static reading. Without this type of physical engagement, an individual can maintain healthy blood pressure yet still be at risk for reduced cardiac efficiency or early atherosclerosis. Therefore, a good score on the blood pressure and heart rate chart is only part of a broader equation that includes physical fitness, metabolic health, and lifestyle habits.
5. How reliable are wearable devices for tracking the healthy blood pressure and pulse rate chart at home? Wearable technology has dramatically improved, and many devices offer reasonably accurate heart rate monitoring. However, their blood pressure readings can be less consistent unless the device uses clinically validated cuff-based methods. While it’s useful to refer to your wearable data in relation to the healthy blood pressure and pulse rate chart, you should always corroborate those results with a validated medical device, especially if making decisions about your health. Moreover, consistency is key—monitoring under similar conditions (same time of day, same posture, calm environment) enhances reliability. For long-term tracking, wearables can be valuable for identifying trends, even if the individual data points aren’t always perfect.
6. Can the hydration status altar where I fall on a blood pressure and heart rate chart? Yes, hydration plays a surprisingly central role in cardiovascular regulation and can influence your readings on the blood pressure and heart rate chart. Dehydration reduces blood volume, prompting the heart to beat faster and sometimes causing a dip in blood pressure. This physiological adjustment can result in misleading numbers that do not reflect your typical cardiovascular state. Overhydration, though less common, can also lead to blood pressure increases due to excess volume. Ensuring consistent fluid intake, especially during endurance training or hot weather, supports a more stable position on a healthy blood pressure and pulse rate chart.
7. What role does sleep play in supporting a healthy blood pressure and pulse rate chart? Quality sleep is essential to maintaining a healthy heart rhythm and blood pressure profile. During sleep, especially deep stages, your parasympathetic nervous system becomes dominant, lowering both heart rate and blood pressure. Insufficient or fragmented sleep disrupts this restorative cycle and contributes to chronically elevated numbers on the blood pressure and heart rate chart. Over time, poor sleep can lead to dysregulated hormonal patterns, increased inflammation, and even insulin resistance—all of which further compromise cardiovascular function. Prioritizing sleep hygiene and treating sleep disorders like sleep apnea can dramatically enhance where you fall on the healthy blood pressure and pulse rate chart.
8. Can gender and hormonal cycles affect the accuracy or interpretation of the blood pressure and heart rate chart? Yes, gender and hormonal fluctuations have a notable impact on cardiovascular metrics. For women, blood pressure and pulse rate can vary across different phases of the menstrual cycle due to shifts in estrogen and progesterone. Postmenopausal women may also experience a gradual increase in blood pressure due to declining estrogen levels. Similarly, hormonal changes during pregnancy or thyroid dysfunctions in either gender can skew chart readings. Thus, interpreting your position on a healthy blood pressure and pulse rate chart must be done with awareness of these physiological contexts. Individual baseline ranges should be established over time to account for such hormonal dynamics.
9. How do medications influence the readings on a healthy blood pressure and pulse rate chart? Various medications can significantly alter your placement on a blood pressure and heart rate chart. Beta blockers, for instance, are designed to reduce heart rate and blood pressure, often bringing them well below what is typical for the general population. Conversely, stimulants used to treat ADHD or nasal decongestants can cause temporary elevations. Diuretics, commonly used for hypertension, may reduce blood volume, lowering blood pressure but sometimes increasing heart rate as a compensatory mechanism. When interpreting the healthy blood pressure and pulse rate chart, always consider any medications you’re taking and discuss trends with your healthcare provider, especially before making changes to dosage or lifestyle routines.
10. What future developments could change how we use the blood pressure and heart rate chart? The future of cardiovascular health monitoring lies in dynamic, personalized models that evolve beyond static charts. Integrating machine learning algorithms and biometric data across multiple platforms will likely replace the one-size-fits-all healthy blood pressure and pulse rate chart. These tools may soon provide personalized cardiovascular baselines, factoring in genetics, lifestyle, environment, and stress patterns to predict disease risk more accurately. Wearables and home-monitoring devices may become capable of real-time diagnostics and alert users to subtle warning signs long before clinical symptoms emerge. As technology advances, we may no longer be asking “does good blood pressure mean healthy heart?” but rather “how personalized is my cardiovascular profile—and what does it forecast for my health in the next decade?”
Conclusion: What the Blood Pressure and Heart Rate Chart Really Tells You About Your Health
Understanding the healthy blood pressure and pulse rate chart is about far more than checking off a box during an annual physical. These metrics are foundational to cardiovascular insight, offering a window into your heart’s capacity, resilience, and risk. While many wonder, “does good blood pressure mean healthy heart?”, the answer requires a broader perspective. Blood pressure and heart rate are critical indicators, but they must be interpreted in the context of lifestyle, stress, fitness levels, and broader medical data.
For those engaged in endurance training or performance enhancement, regularly reviewing this chart can transform how you train, recover, and protect your long-term health. Even for those not pursuing athletic excellence, these numbers provide an accessible and effective way to monitor the body’s inner workings. Empowered with this knowledge and aided by advancing technology, individuals can take meaningful steps toward optimizing both heart health and physical performance. In doing so, the chart becomes not just a clinical tool, but a powerful ally in the pursuit of a longer, healthier, and more vibrant life.
Was this article helpful? Don’t let it stop with you. Share it right now with someone who needs to see it—whether it’s a friend, a colleague, or your whole network. And if staying ahead on this topic matters to you, subscribe to this publication for the most up-to-date information. You’ll get the latest insights delivered straight to you—no searching, no missing out.

